

Reporting Sneak Peak!
Our team is working hard to build super useful reporting that will help you understand your community's growth. Here is the sneak peak.
What's the most useful data you want to see in the reporting?
Planned Release date: Next Friday (31st January)
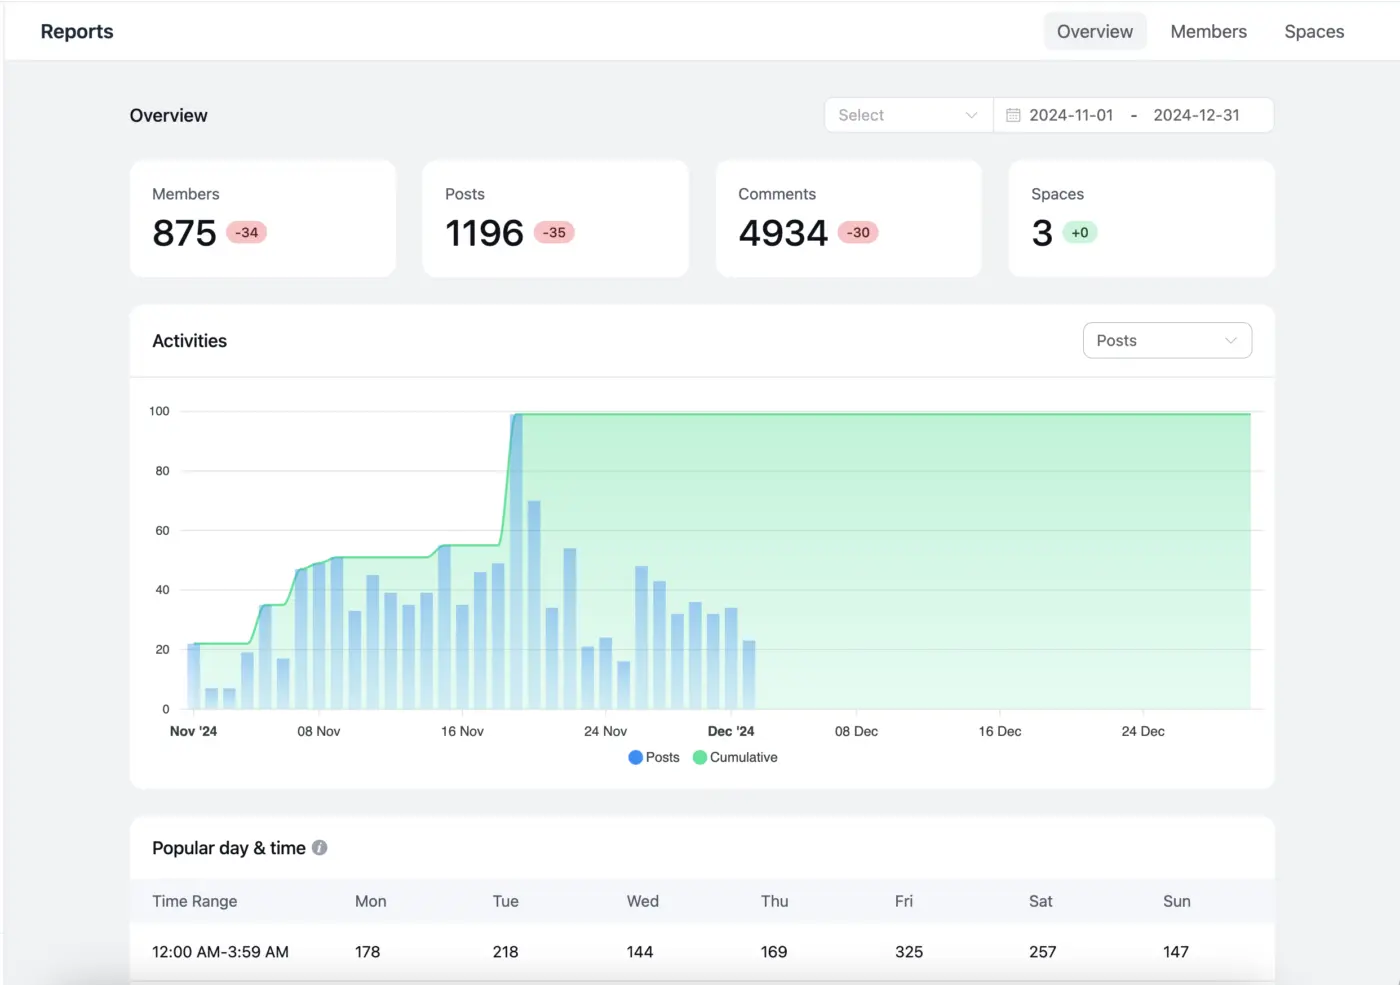

Amazing as usual

Please make the information a shortcode. So that we can use this information on our website instead of only on boards.

Amazing, is courses reporting will have same view?

So cool!

Tracking the number of participants in events would be really great when this feature becomes available. This would make it possible to measure the commitment of the most invested users on our platform.

I'd like to see how the members are distributed across the levels, i.e. what percentage are still at level 1, how many are at level 2, etc.
(Actually, it would be great if there was a separate leaderboard for each space.)
Anyway, I'm looking forward to the statistics, it looks great, Shahjahan Jewel

Amazing view, what about getting the same report as the Facebook groups? and, what about for courses? there will be stats too?
p.s. there will be a dark mode for this view too?

Engagement! Number of posts without engagement and with.
Percentage of repeat posters as opposed to just one time. How active they are

It would be nice to have the list of spaces in the table view with the following metrics ( for the selected period of time): visitors #, posts #, images #, videos #, comments #, likes #, replies #, number of active members (ex. members that created at least 1 post or comment).
Also list of courses and lessons in the table view with the following metrics ( for the selected period of time): visitors #, completion rate, comments #, likes #, replies #, how many times on average each lesson is started/viewed by one member.

Great news, thanks Shahjahan Jewel .Is it possible to see course/lesson engagement report? Thanks

Anri Maglakelidze Exactly!

Very cool, number of posts and comments are great

Dammn!!!! Fiiiiiiiiiiire 👌💯💯 GOOD JOB
We want an option to filter words on comments, to protect our comunity
Information that would be very useful is related to the students' performance in the courses. What they have accessed or not, lessons they marked as completed or not, in short, data about their studies. That would be fantastic!

Elisa Faria Absolutely, If LMS is a core part of this plugin, LMS requires a lot more functionality. The whole reason Circle was created which FluentCommunity is modelling after is integrating a community into a LMS.

Crazy. Good job. Any news regarding the theme compatibility?

It is important to have this information separately for each space.

We can refer to Skool report 👉https://www.loom.com/embed/29c0f5ebce9e4b9587ec5291c74da9d1?autoplay=0&hide_owner=true&hide_share=true&hide_title=true&hideEmbedTopBar=true
What I like most about Skool is the Daily activity for each member, clearly understanding the rhythm of their activities.
Nang Ha this I will love too

Love it!

What about data on user sign-ins? It’s crucial to understand how often members are returning to the community
Engagement Rate and possibility to display members etc Like Skool in the landing page to ente

Download reports ♥️
Jorge de los Reyes This is important!
Average time connected would be useful!
Nothing worse than a dead community…


Awesome! Can you consider on putting in more insightful data sets and mybe the ability to turn off certain KPIs? For example I don't know why I should track spaces at the top right. It's not a useful KPI in my opinion. Maybe things like average post per member, new members or so to see how healthy the community is. Im sure other people also might have great ideas what specifically to track to make communities flurish :)

Any update ? We re friday
Jéjé immobilier no release at all

Jéjé immobilier We decided to release on Monday.
Shahjahan Jewel this monday? :D

Great addition! I'd like to receive a notification in case the engagement/activity rates are falling under a custom defined threshold (per space or globally). Rather than receiving reports on a weekly or monthly base.

Wow. Your team rocks.

What about 3rd party analytics like GA, Pirsch, Piwik ?